Northern North Sea (Seasonal)
This Northern North Sea seasonal experiment has been carried out in the
framework of the PROVESS (PROcesses of VErtical mixing in Shealf Seas) project
(MAS3-CT97-0025, 1998-2001) which has been funded by the European Communities
MAST-III program. The observations in the Northern North Sea were carried out
in September and October 1998. Here, a period of 20 days from October 7 - 27,
1998 is simulated. All forcing and validation data have been carefully
processed from observations during this PROVESS-NNS experiment.
[caption id=“attachment_525” align=“aligncenter” width=“640”]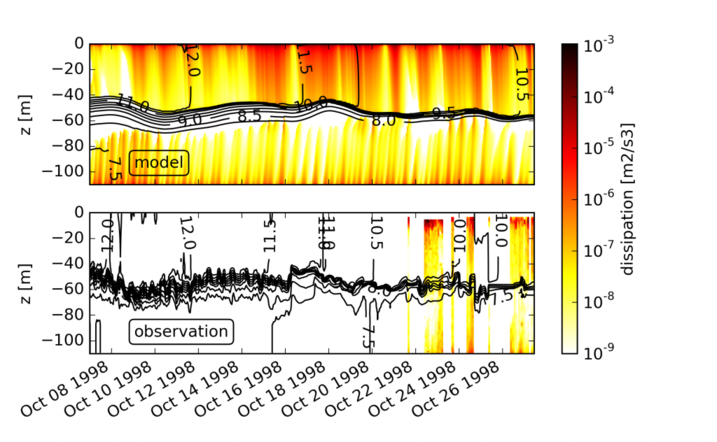 Temperature contours and dissipation rate during 20 days of autumn cooling in
the Northern North Sea. The dissipation rate measurements are from the FLY
profiler. This plot was created with
nns_seasonal.py.
[/caption]
Two different observed dissipation rate data sets are
included: eps_fly.dat: data from a FLY profiler, processed by School of Ocean
Sciences, University of Bangor, Wales eps_mst.dat: data from an MST profiler,
processed by the Joint Research Centre, Ispra, Italy. These files are read in
into GOTM through the eobs namelist in obs.nml. The dissipation rate has only
been observed at short intervals, periods without observations are set to
minimum values in the files. These dissipation rate observations are read in
into GOTM in order to allow for proper interpolation to the temporal and
spatial output steps, and they are not used for any type of nudging. The data
files are prepared such that the maximum simulation interval can be extended to
September 7 at 10.00 h - November 2 at 13.00 h, 1998. For discussions of
various model simulations, see
Burchard et al. (2002)
and also the annual simulation in the test case nns_annual and
Bolding et al. (2002).
Temperature contours and dissipation rate during 20 days of autumn cooling in
the Northern North Sea. The dissipation rate measurements are from the FLY
profiler. This plot was created with
nns_seasonal.py.
[/caption]
Two different observed dissipation rate data sets are
included: eps_fly.dat: data from a FLY profiler, processed by School of Ocean
Sciences, University of Bangor, Wales eps_mst.dat: data from an MST profiler,
processed by the Joint Research Centre, Ispra, Italy. These files are read in
into GOTM through the eobs namelist in obs.nml. The dissipation rate has only
been observed at short intervals, periods without observations are set to
minimum values in the files. These dissipation rate observations are read in
into GOTM in order to allow for proper interpolation to the temporal and
spatial output steps, and they are not used for any type of nudging. The data
files are prepared such that the maximum simulation interval can be extended to
September 7 at 10.00 h - November 2 at 13.00 h, 1998. For discussions of
various model simulations, see
Burchard et al. (2002)
and also the annual simulation in the test case nns_annual and
Bolding et al. (2002).