Northern NS (Annual)
Here the annual simulation of the Northern Sea at 59 deg 20’ N and 1 deg
17’ E during the year 1998 as discussed by
Bolding et al. (2002)
is
performed. For this simulation, time series of surface slopes were extrapolated
from observations during autumn 1998 based on four partial tides by means of
harmonic analysis. All necessary meteorological data are from the UK
Meteorological Office Model in a 6-hourly temporal resolution (meteo.dat). For
the period of the PROVESS campaign (Sep 7 - Nov 7, 1998, see
Howarth et al., 2002
;
Bolding et al., 2002)
higher resolution data (half-hourly) from research vessels are available and
pasted in an extended meteo data file (meteonns.dat). See GOTM test case
nns_seasonal for a shorter term scenario only including the campaign period.
For calculating the resulting surface fluxes, the bulk formulae from
Kondo (1975)
are used here. For
the evolution of the vertical salinity profile, which is known to stabilise
stratification during summer months, a relaxation to results obtained with a
prognostic three-dimensional model of the North Sea (
Pohlmann, 1996
). By
doing so, the horizontal advection, which is the dominant process for salinity
dynamics in the Northern North Sea, is parameterised.
[caption id=“attachment_517” align=“aligncenter” width=“640”]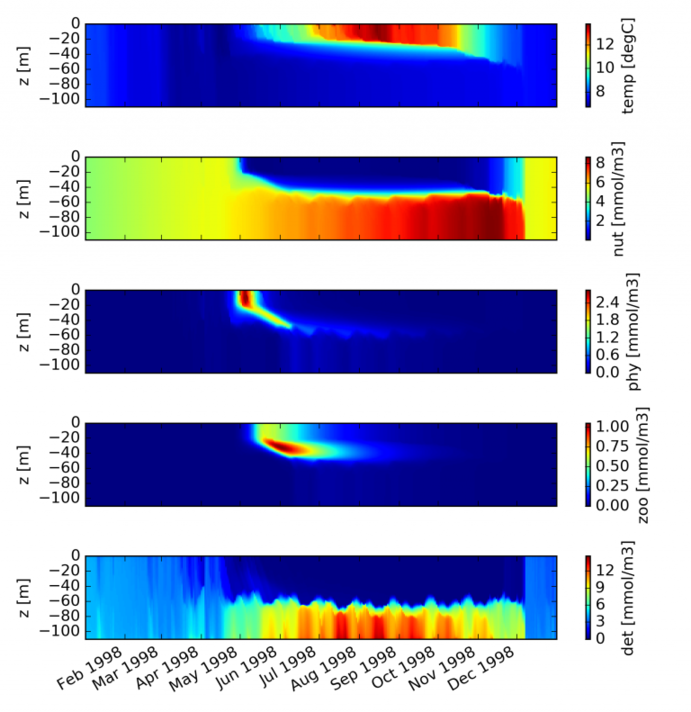 Annual
cycle of simulated temperature and NPZD development at the PROVESS-NNS site in
the Northern North Sea. This plot was created with
nns_annual.py.
[/caption]
The nns_annual scenario is also used as a basis for driving the
NPZD model. This is achieved by choosing fabm_calc = .true. (in gotm_fabm.nml),
and models = ‘gotm_npzd’ in fabm.nml.
Annual
cycle of simulated temperature and NPZD development at the PROVESS-NNS site in
the Northern North Sea. This plot was created with
nns_annual.py.
[/caption]
The nns_annual scenario is also used as a basis for driving the
NPZD model. This is achieved by choosing fabm_calc = .true. (in gotm_fabm.nml),
and models = ‘gotm_npzd’ in fabm.nml.