This case demonstrates the use of Stokes drift module to drive Langmuir turbulence models in GOTM. Currently, we have two Langmuir turbulence models implemented in GOTM, including a modified Mellor-Yamada model that includes the production terms due to Stokes drift shear as described in Kantha and Clayson (2004, hereafter KC04), and a modified KPP model via CVMix that includes Langmuir-enhanced turbulent velocity scale and Langmuir-modulated boundary layer entrainment as described in Li and Fox-Kemper (2017, hereafter LF17). Both models require input of Stokes drift profiles, but they use the Stokes drift profiles differently. KC04 requires vertical shear of Stokes drift, which in this example is computed from the Stokes drift profile, but can also be read from a file. LF17 only needs the surface layer averaged Stokes drift, which is computed from the Stokes drift profile.
In this test case, the surface forcing data is from the Ocean Weather Station Papa (OWS Papa) and Stokes drift is computed from the surface wave spectrum collected at the Waverider Mooring at the same site by APL-UW. See Section 3.2 of Li et al. (2021) for more information on this case. Surface forcing and T/S profiles are provided at hourly frequency. Both surface Stokes drift and Stokes drift profile are provided roughly every half an hour. The maximum simulation time allowed by the included forcing data is March 21, 2012 - March 20, 2013, covering one annual cycle at OWS Papa. Note that there is a data gap between September 21, 2012 and October 4, 2012 in the Stokes drift.
The figure below compares the simulated temperature in KC04 and LF17 and the observation. Note that in both models we prescribe the surface fluxes rather than computing the fluxes from the meteorological data and simulated SST and currents, which may have caused the overly warm surface temperature as compared with the observation due to the unbalanced surface heat flux by missing the lateral transport. The python script used to generate the figure below is also provided plot_langmuir.py, which also plots the surface forcing conditions.
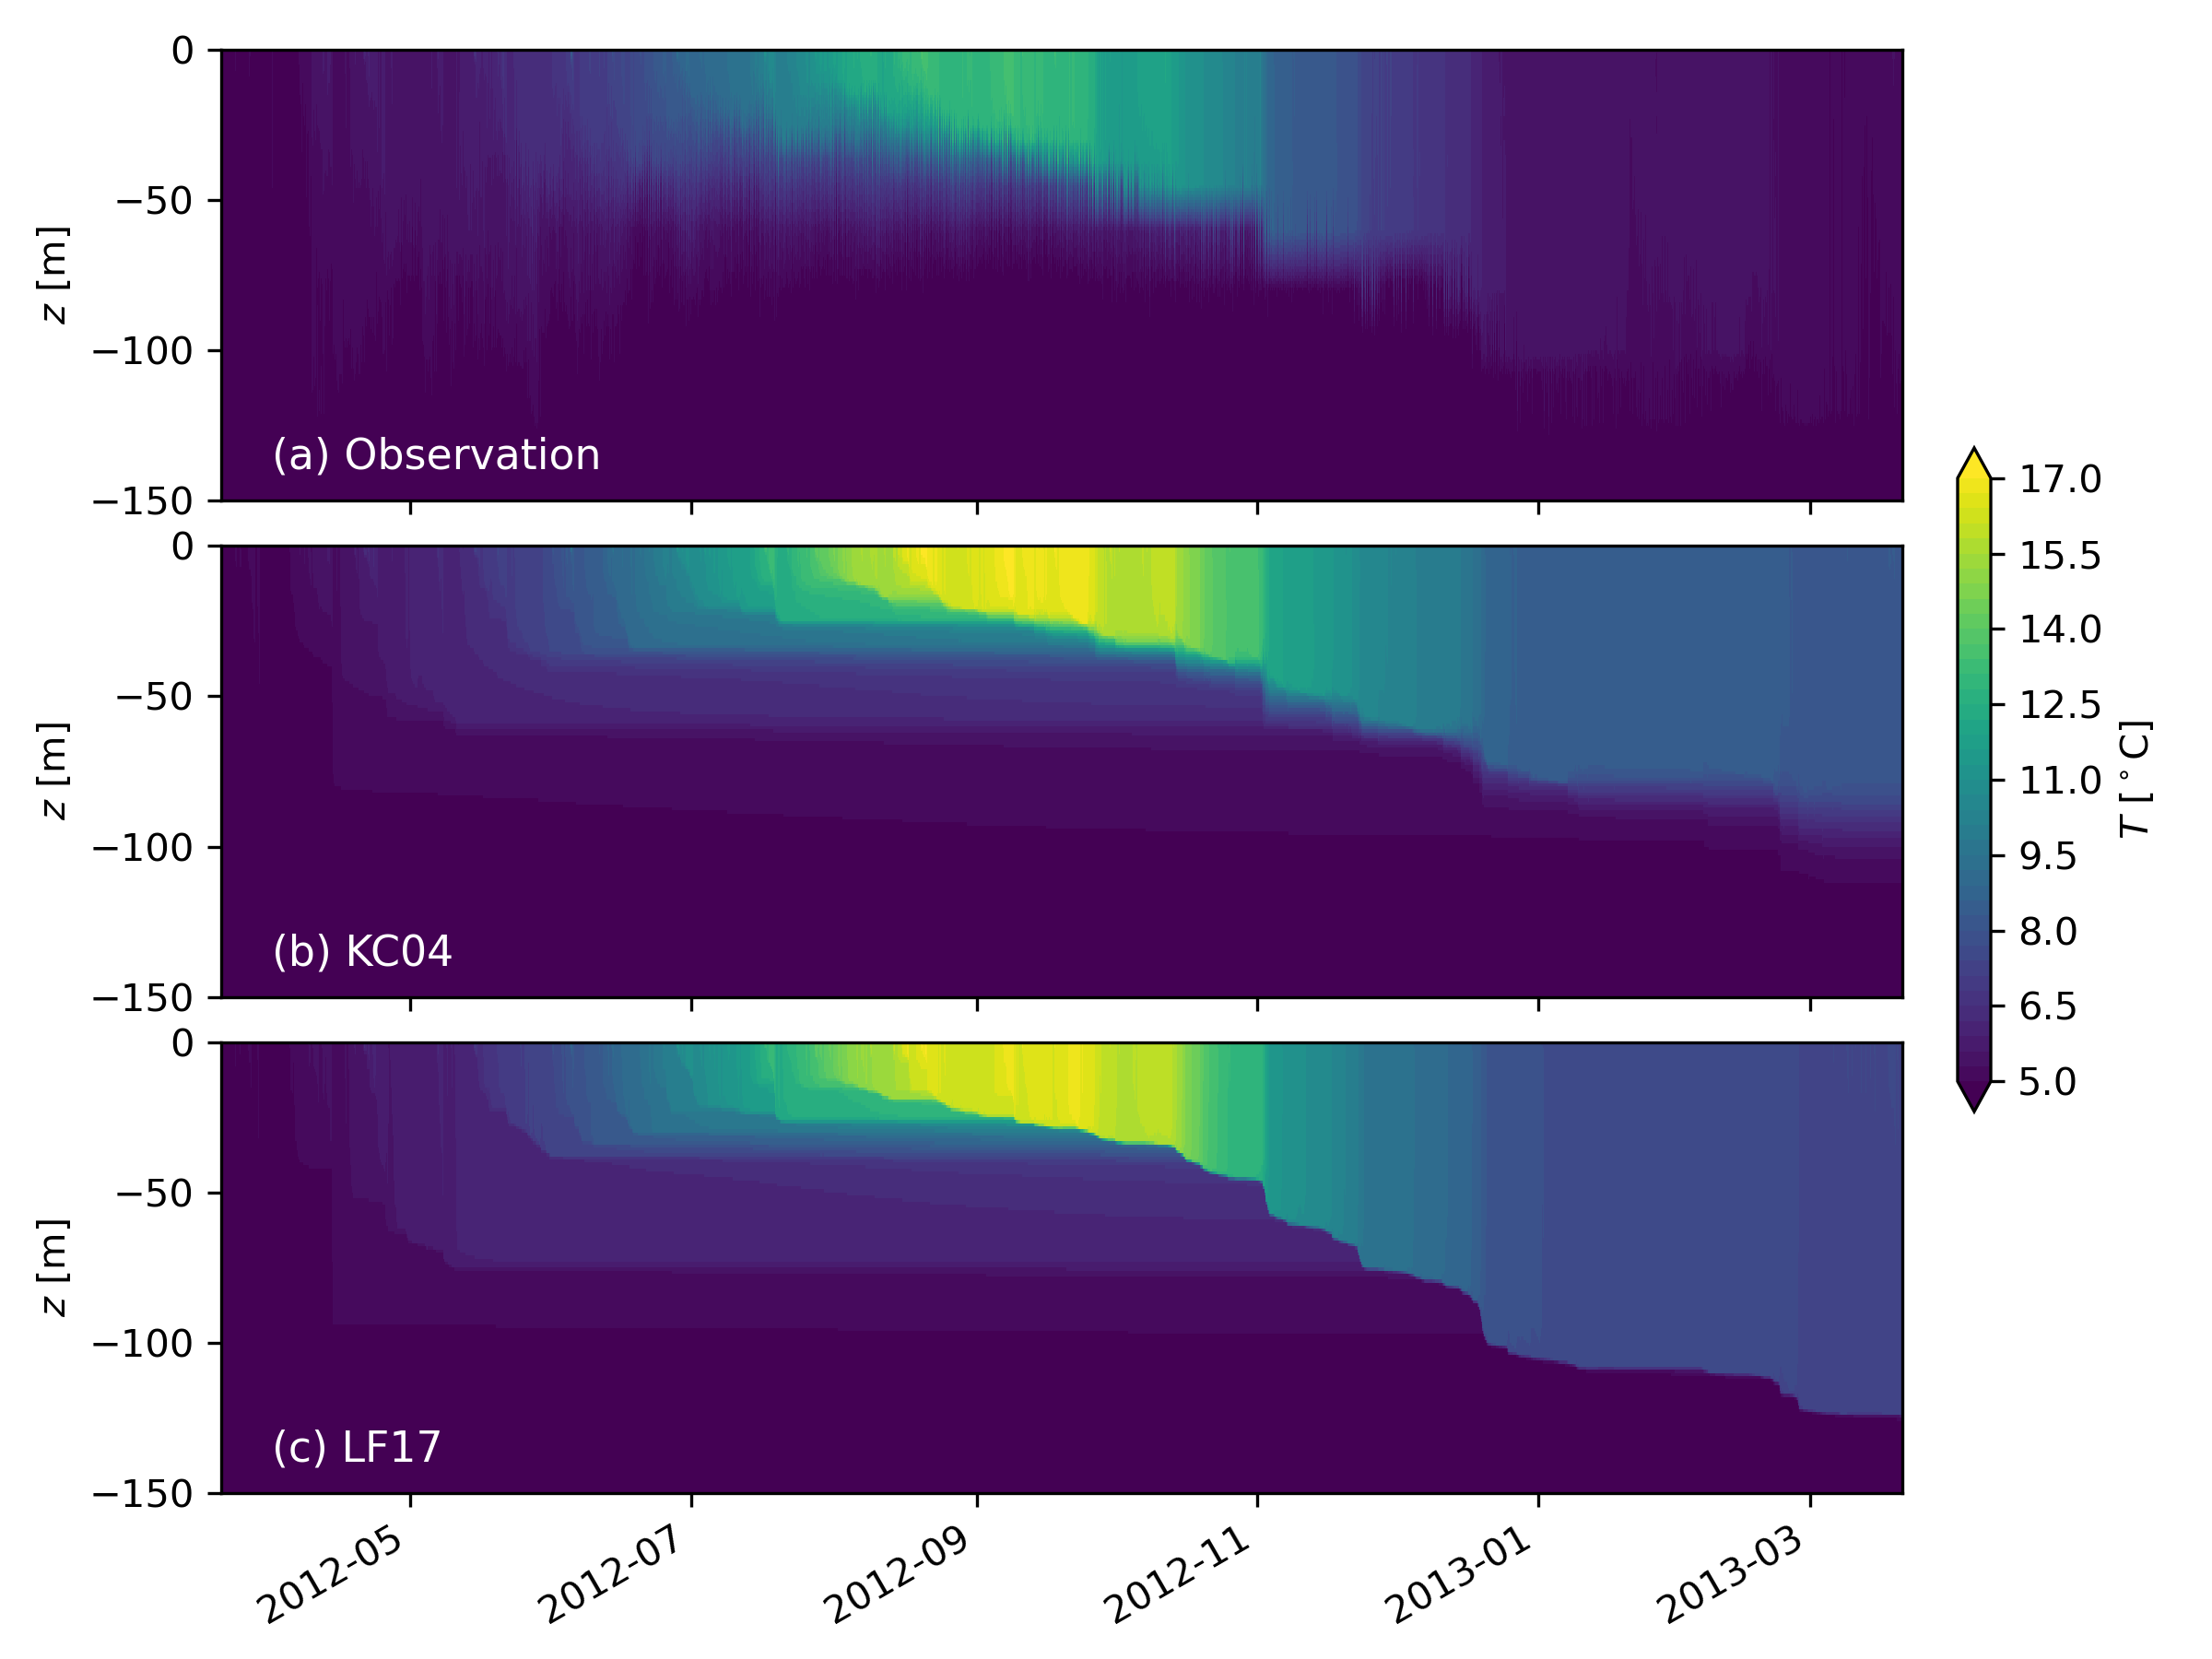
Evolution of temperature at OWS Papa from (a) the observation, and simulations using the (b) KC04 and (c) LF17 models.